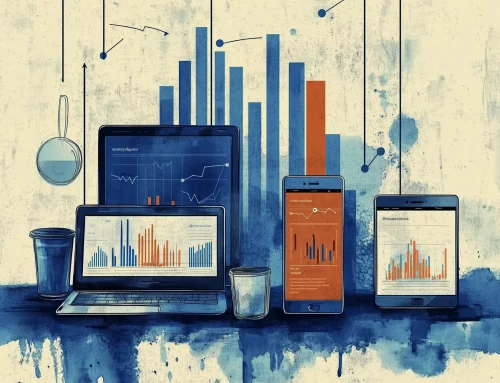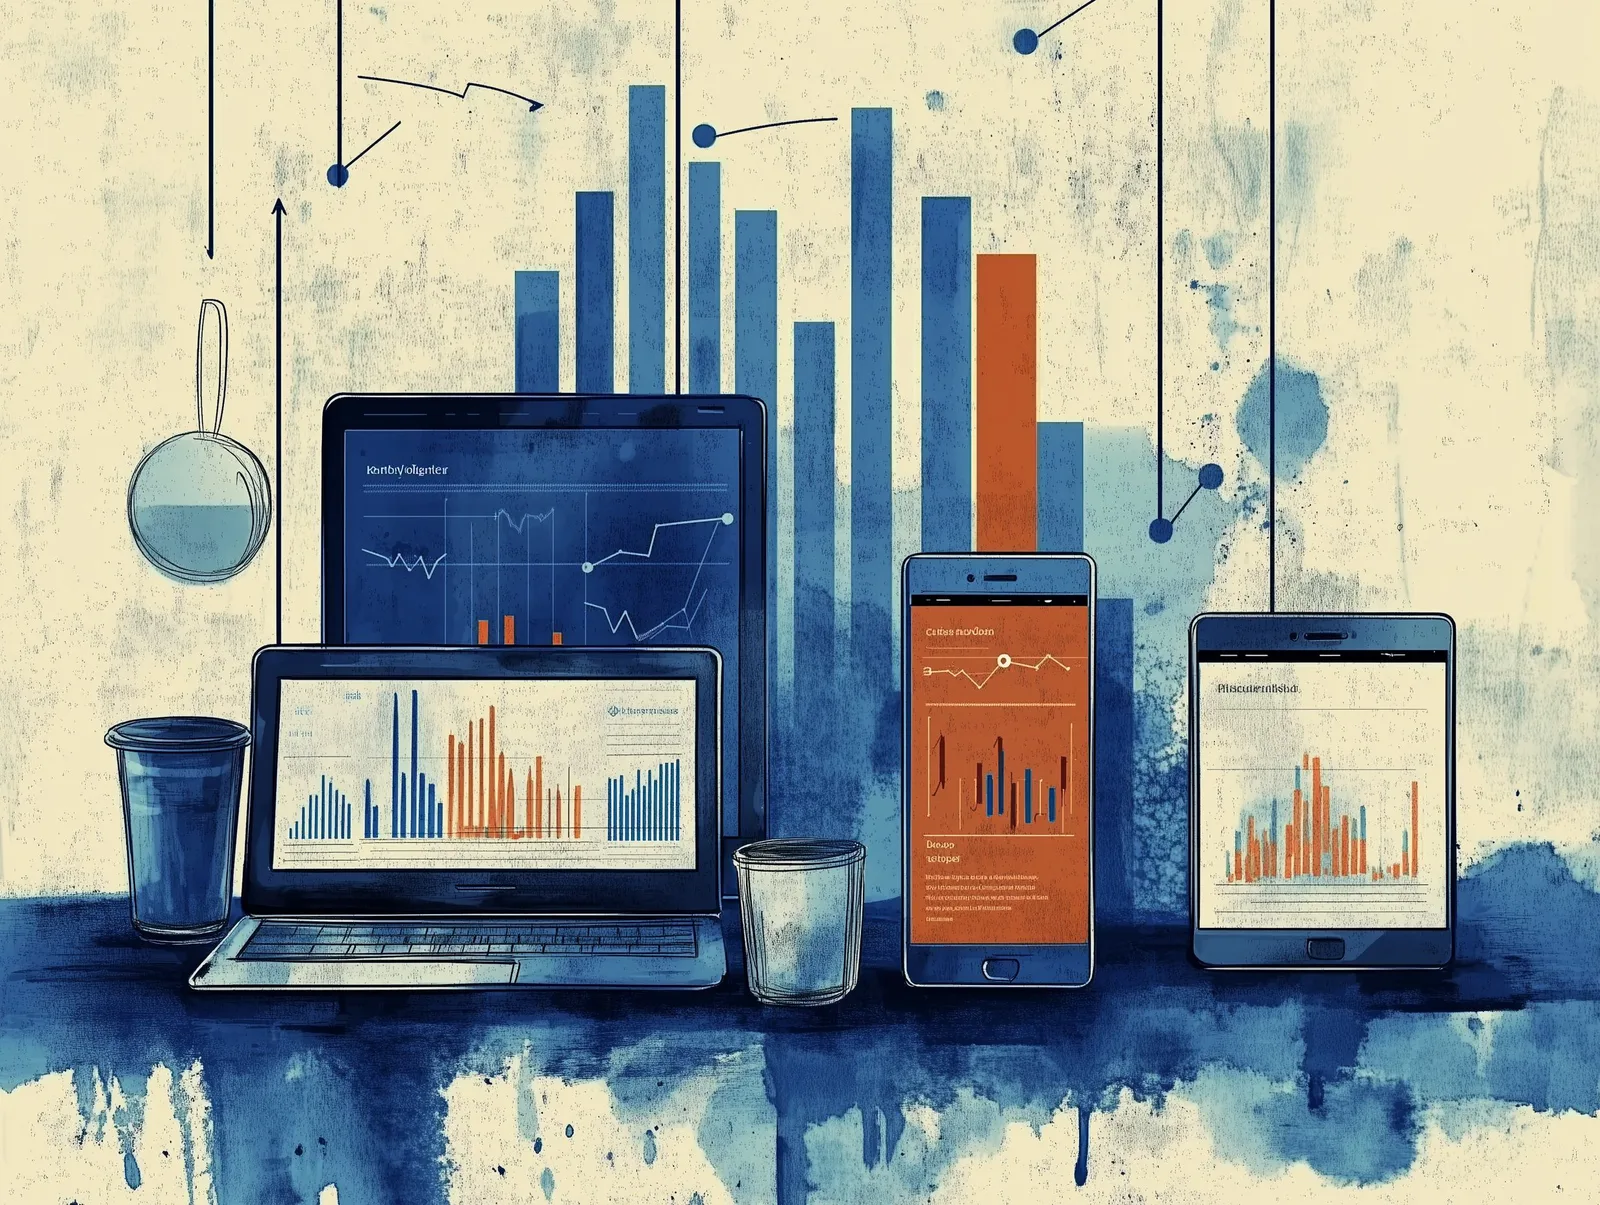
Dashboards are designed to show what is happening across a business. Their value declines, however, when information arrives after the moment to act has passed. A campaign can lose conversions between reporting cycles, a customer’s intent can change before the next sales review, and suspicious transactions can accumulate while data waits for batch processing.
Websites, applications, payment systems, connected devices, and business software now generate events continuously. Vyansa Intelligence research on the global real-time streaming analytics market estimates a value of USD 5.3 billion in 2025 and USD 5.99 billion in 2026, with a forecast of USD 10.1 billion by 2032 at a 9.65% CAGR from 2025 to 2032. Behind this growth is a practical need: teams want to assess important signals while those signals can still influence a decision.
Dashboards Are Not the Problem. Delay Is.
Historical dashboards remain useful for budgeting, performance reviews, trend analysis, and strategic planning. Those tasks often benefit from a consolidated view of reliable data rather than constant updates. Time-sensitive decisions are different because information can lose value as people wait.
Consider a campaign with a sudden drop in conversions. A next-day report may show exactly what went wrong, but the campaign could have continued spending against the same audience or creative for hours. Monitoring live events can surface a material change earlier, giving marketers time to investigate and adjust while the campaign is still running.
The distinction is not between dashboards and streaming systems. Retrospective analytics explains what happened, while live monitoring helps teams see what is happening now. A useful system then routes the signal to an appropriate response, such as an alert, investigation, or controlled automated action. The goal is not to make every metric instant. It is to make decision-critical information available in time.
What Changes When Data Starts Streaming?
Streaming analytics evaluates events as they arrive rather than waiting for information to accumulate in a scheduled batch. Clicks, transactions, application logs, and sensor readings can be filtered, transformed, combined, and assessed continuously. Rules or analytical models can then identify meaningful patterns, compare events against thresholds, and flag activity that needs attention.
IBM’s June 2026 overview of streaming analytics explains how continuous data processing supports use cases such as fraud detection, personalization, and operational monitoring. For business teams, the key point is what happens after analysis: an insight can be sent to a dashboard, routed to a person, or used to initiate a workflow while the underlying event is still relevant.
Where Real-Time Signals Can Change Business Response
Campaign Performance: Adjust While Activity Is Running
B2B marketing teams do not need every metric updated every second. They do need timely visibility when a meaningful change appears. Streaming analytics can monitor conversion, engagement, and other selected measures, helping marketers investigate underperforming audiences, placements, or creative before more budget is committed. The system is most useful when paired with a clear process for deciding who should act and what changes are permitted.
Customer Behavior: Respond While Intent Is Current
A single visit to a pricing page may mean little. Several visits, product comparisons, and renewed engagement within a short period can form a stronger signal when considered together. Real-time processing can route that activity to the relevant sales or service team while the customer’s interest is still current. This helps prioritize follow-up without treating every click as a buying decision or replacing human qualification.
Operational Alerts: Detect Drift Before Disruption
Equipment readings, application logs, network events, and connected devices can reveal when conditions begin to move away from expected ranges. Continuous analysis can identify meaningful deviations closer to when they occur, then trigger an alert or workflow for an operator to investigate. The objective is to distinguish important exceptions from routine fluctuations, not to notify staff about every change.
An example comes from video streaming. In a September 2026 AWS case study, Sony LIV’s analytics architecture reduced data latency from hours to seconds and supported visibility into viewer engagement and streaming quality during high-volume events. The lesson applies beyond media: quicker access to operational signals can help teams investigate issues before they affect more users.
Fraud Detection: Timing Is Part of the Signal
A payment may appear ordinary on its own, while a sequence of related transactions or account changes can indicate risk. Streaming systems evaluate new activity alongside recent events and can trigger a review when defined patterns or thresholds suggest possible fraud. Human oversight remains important for high-impact decisions, but lower detection latency can reduce the time between suspicious activity and investigation.
Sales and Performance: Prioritize Current Signals
Customer and sales data often sit across CRM tools, websites, product environments, and other systems. Streaming analytics can bring recent engagement and changes in account behavior into a more current view. Sales teams can use those signals to prioritize accounts, while retaining the qualification and judgment needed to distinguish genuine intent from routine activity.
Real-Time Does Not Mean Everything Needs to Be Real-Time
Speed cannot compensate for poor data. Missing fields, duplicate records, inconsistent identifiers, and conflicting values can distort streaming results just as they can undermine batch reports. Continuous processing may expose issues sooner, but data validation, standardization, and cleansing still need to happen at the right points in the pipeline.
Alert quality matters, too. A team receiving dozens of low-value notifications may become slower to respond to the events that matter most. Appropriate thresholds, prioritization, and context help distinguish meaningful exceptions from normal variation. Alerting should reflect the decisions people need to make, rather than the volume of events a platform can process.
The required speed depends on the decision. Fraud checks and operational incidents may need near-immediate attention, while quarterly planning usually benefits more from historical context. Many organizations need both approaches: streaming analytics to evaluate current activity and historical analysis to put those events into perspective.
From Faster Dashboards to Faster Decisions
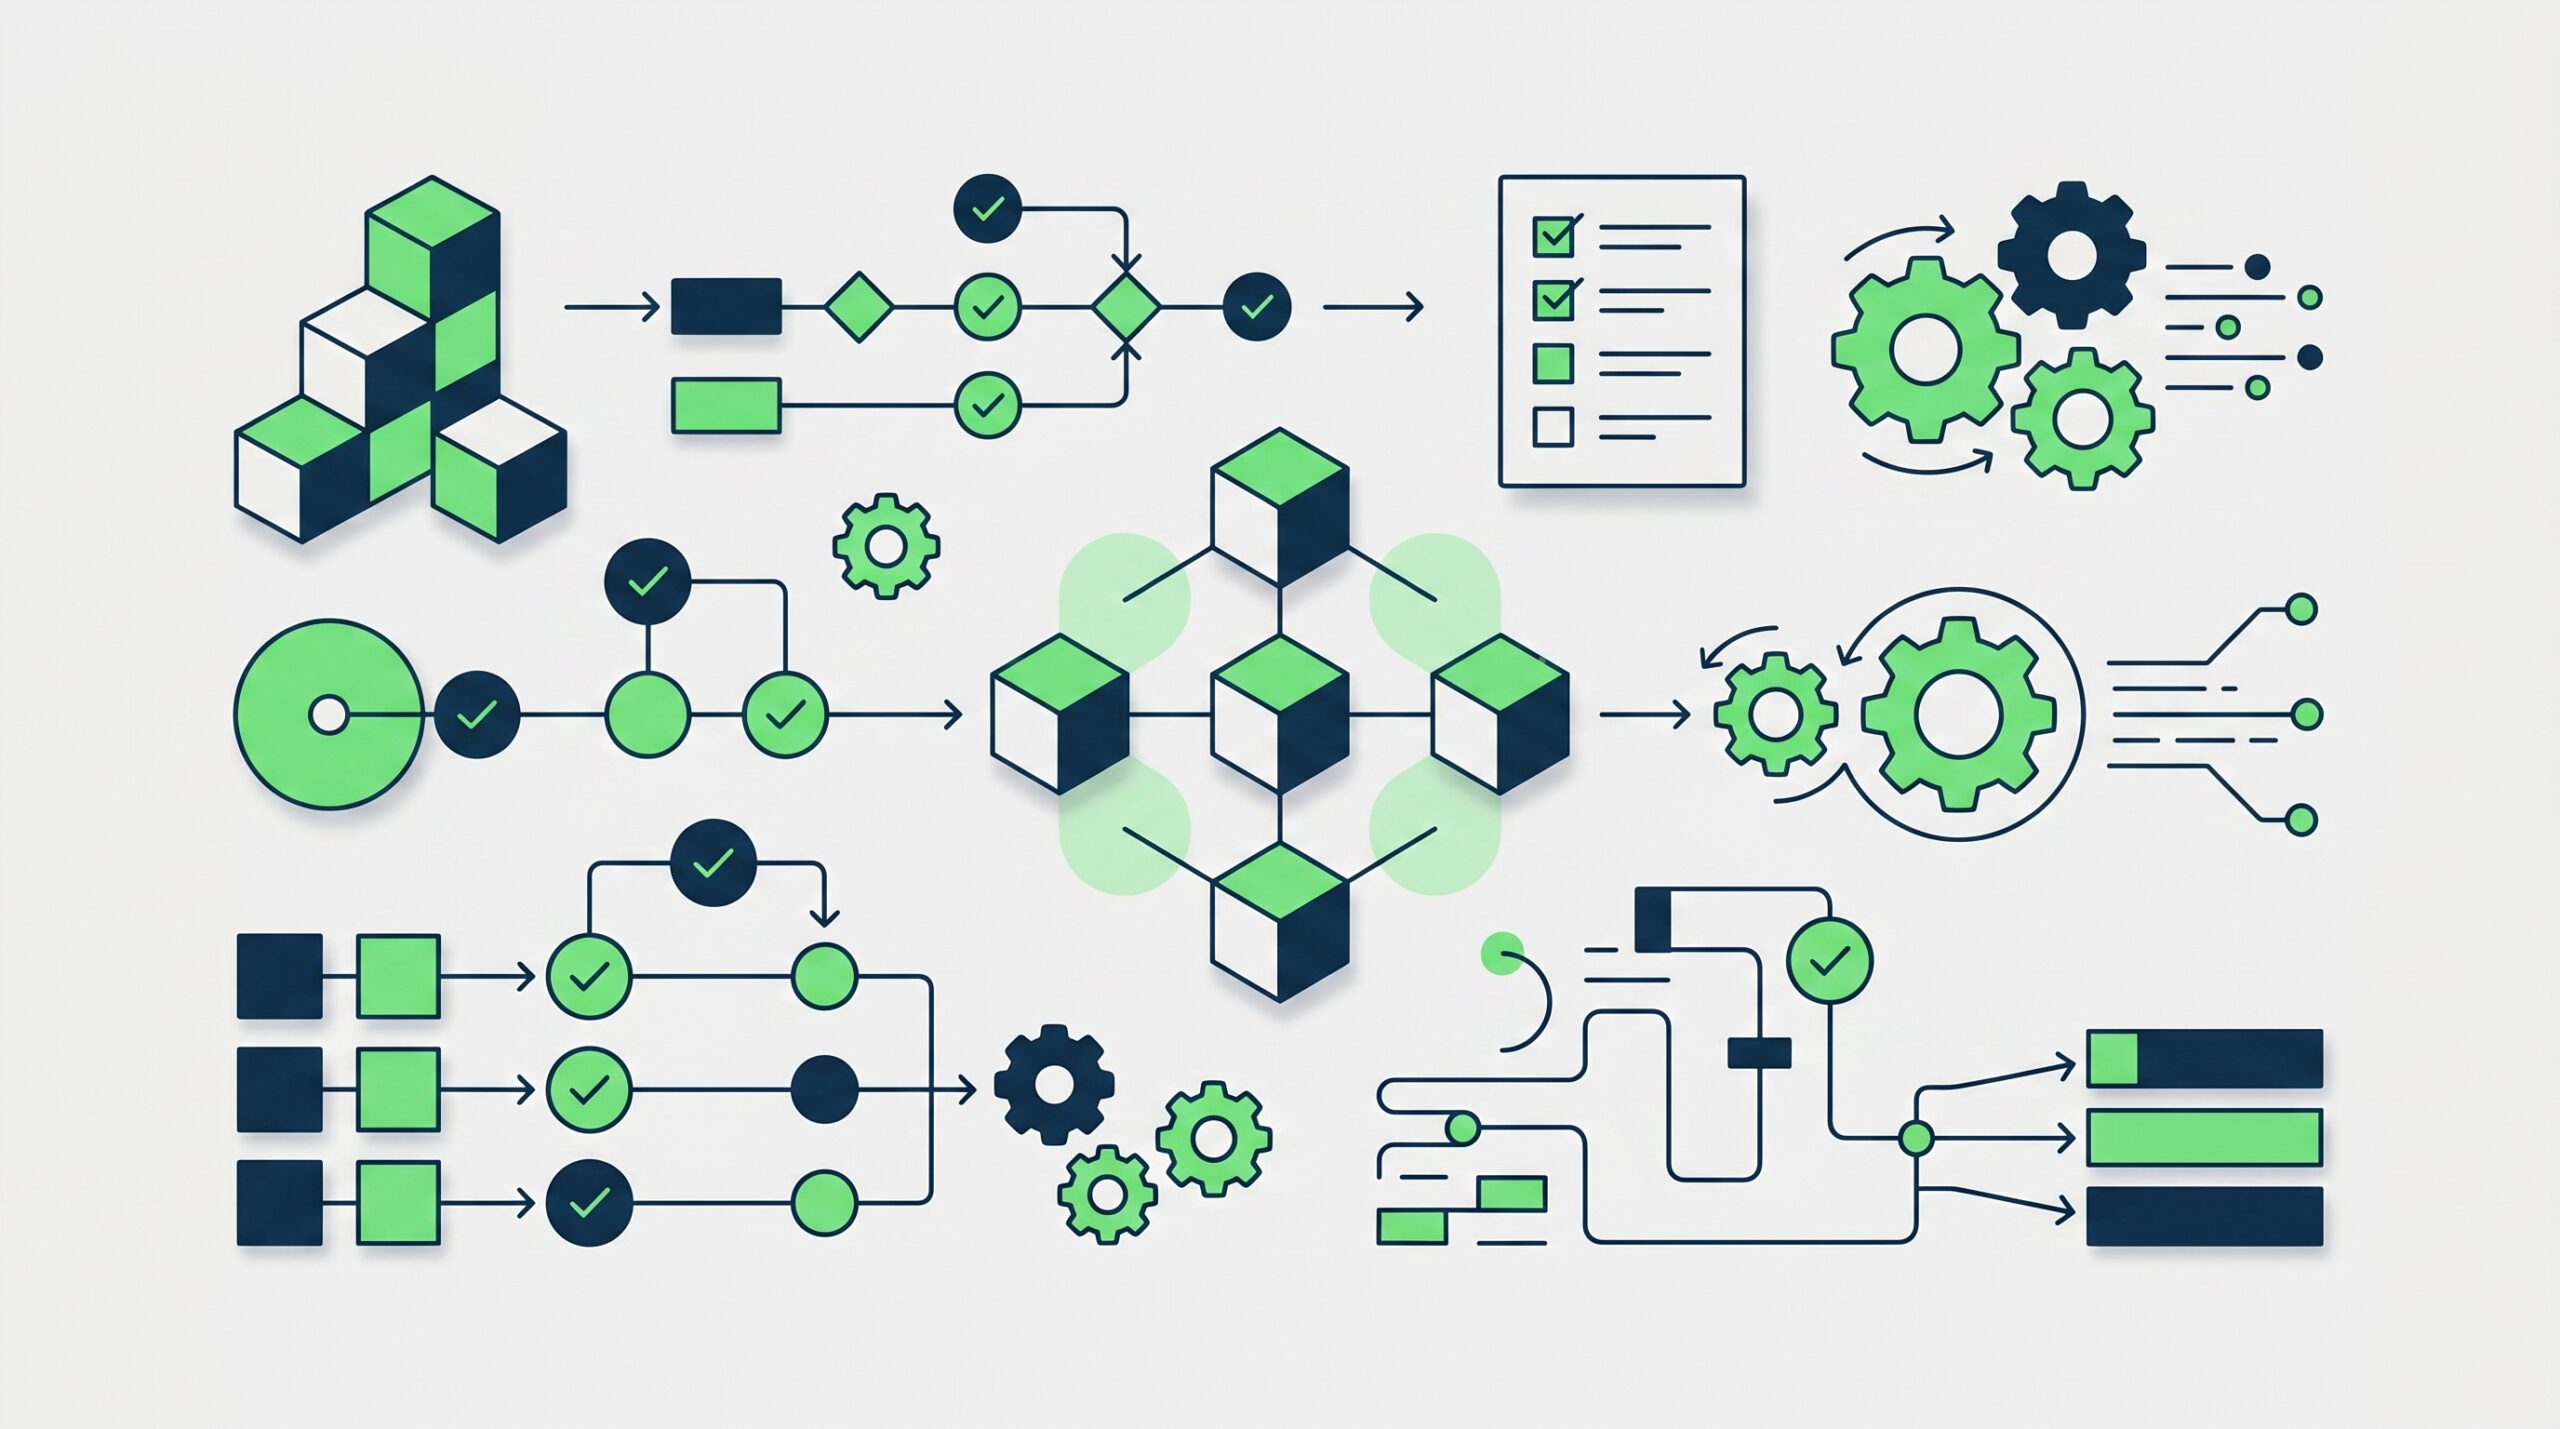
An effective implementation connects analytical signals to the workflows responsible for acting on them. A dashboard helps people observe a change. A decision-oriented system can also provide context, notify the right person, create a case, or initiate a predefined action.
Human review is appropriate when consequences are significant or conditions are difficult to define in advance. Automation can be suitable when rules are stable, exceptions are manageable, and outcomes can be monitored. The important design question is which signals need interpretation and which can be acted on reliably through established workflows.
A data and analytics strategy should measure more than dashboard refresh time. Detection latency shows how quickly an event is identified. Signal-to-action time measures the interval between detection and intervention. False-alert rate indicates whether irrelevant notifications are overwhelming the team, while response rate shows whether useful alerts lead to action. These measures should ultimately connect to business outcomes such as conversion, uptime, retention, fraud exposure, or sales progression.
A dashboard can refresh every few seconds and still leave a decision waiting for manual interpretation. Faster processing creates value when it shortens the distance between a meaningful signal and a useful response.
The Dashboard Is Staying. The Waiting Is Not.
Dashboards remain useful for historical analysis, management reviews, and planning. Streaming analytics serves a different role when information loses value quickly and waiting for the next reporting cycle can affect an outcome. Some decisions will still call for consolidated reports; others need a live event, alert, or workflow. Many organizations will use both.
The question is not how quickly a dashboard can refresh. It is where delayed information changes the timing, quality, or cost of a decision. When that delay matters, streaming analytics can help teams move from seeing what happened to responding while a signal is still actionable.

Shammi Thakur
Shammi Thakur is Research Director at Vyansa Intelligence, with more than 15 years of experience in market intelligence, forecasting, and competitive research. He translates complex market and technology trends into evidence-based insights for business decision-makers.