B2B Sales · Data & Analytics
When you’re invoicing, but don’t know what makes you money
Decisions based on data
the whole management
team understands.
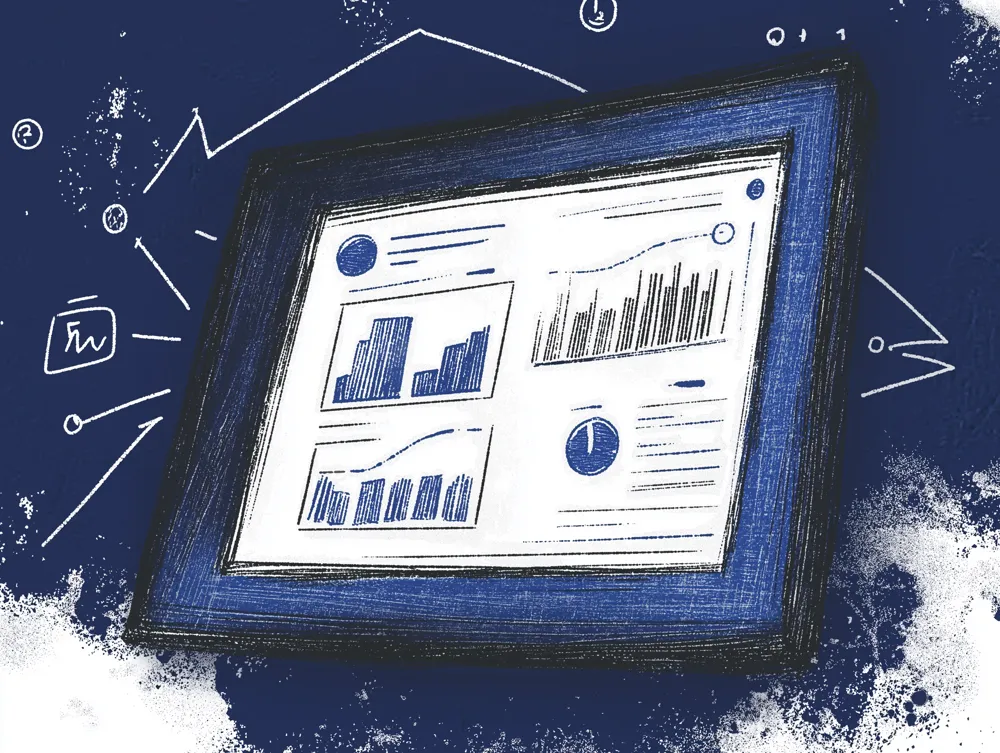
In an industrial company, data is spread across the ERP, the CRM, the website and each department’s spreadsheets. We connect it into a dashboard that answers business questions —what we sell, to whom, at what margin and where orders come from— and that management can check without asking for reports.
What you’ll be able to see
Answers to business questions, not charts for the sake of charts.


You’re deciding blind. Without clear, actionable data, marketing turns into trial and error. We make sure every action is backed by a real metric and every decision rests on an objective basis, not just intuition.
It lets you react sooner, spot deviations quickly and adjust campaigns without waiting for the end of the month. In marketing and sales, timing is everything. We automate data collection and visualization so you’re never too late.
Yes. We build automated dashboards with clear visualizations and practical filters, so you don’t need technical knowledge to understand what’s happening, what to change and which actions to prioritize. The information is within reach of the whole team.
Measuring without a clear goal, relying on vanity metrics, building dashboards without context or overwhelming the team with data. Our job is to avoid those mistakes, make the data easy to read and keep you focused on what drives impact.
When decisions aren’t aligned with the data, when there’s distrust in the reports or when teams don’t share the same vision. A redesign organizes, filters and focuses on what really matters to scale efficiently.
We review tools, workflows, tagging, data quality, dashboard structure and measurement goals. We assess whether what you see reflects what’s actually happening and whether it helps you make decisions. If not, we redesign it from the ground up.
Because if each channel works in isolation, you lose traceability and context. By integrating CRM, advertising, analytics and automation, you connect the key dots and understand the lead’s full journey, from the first click to conversion or loss.
It helps each team see what matters. A good dashboard isn’t just visual: it filters out noise, surfaces opportunities and lets you act without relying on analysts. We tailor it to each user’s level, from management to operations.
Leads generated, conversion rate by channel, average time to close, cost per opportunity, qualified traffic sources… If the data doesn’t connect to the business, it becomes noise. We define metrics that guide real decision-making.
If your metrics don’t answer to specific goals, if each team uses different data or if you make decisions on gut feeling, something is wrong. Measuring well means being clear about what works, what doesn’t and what to do with that information to improve results.